(1)D3.js官方網站:http://d3js.org/
(2)首先引入 d3.js的外掛資料庫(目前有 v3 和 v5版本)
<script src="http://d3js.org/d3.v3.min.js"></script>
(2)在javascript程式內,使用d3.js語法,將之前的 SVG
語法,引入程式之中。
如:
d3.select('body')
.append('svg')
.attr({
'width':200,
'height':200
});
【說明】d3.js以物件屬性與方法的模式,撰寫程式。單元課程4:HTML5
SVG繪圖基本設計應用 課程中
A.HTML svg 的標籤為 <svg width="寬度" height="高度">
...</svg>
B.以 d3.js的語法則是
d3.select('body') => 將會找到 HTML 中
<body>的標籤
d3.select('body')
.append('svg') =>
將會在<body>標籤內,加入 <svg> 標籤
d3.select('body')
.append('svg')
.attr({
'width':200,
'height': 200
});
=> 將會在<body>標籤內,的<svg>標籤內加入 width="寬度" 和 height="高度"
C.如此便是以 d3.js 程式建立一個 HTML SVG 圖形區,以便後續圖形呈現之用。
2.javascript + d3.js 程式化圓形設計
(1) HTML網頁程式參考
|
HTML程式碼 |
執行結果 |
|
<!DOCTYPE html>
<html>
<head>
<script src="http://d3js.org/d3.v3.min.js"></script>
</head>
<body>
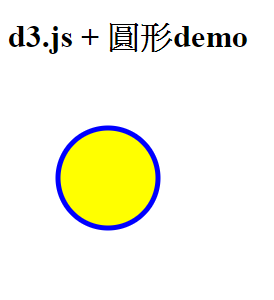
d3.js + 圓形demo <p>
<script>
d3.select('body')
.append('svg')
.attr({
'width':200,
'height':200
});
d3.select('svg')
.append('circle')
.attr({
'cx':50,
'cy':50,
'r':30,
'fill':'yellow',
'stroke':'blue',
'stroke-width':'5px'
});
</script>
</body>
</html>
|
 |
(2)程式設計說明
A.引入 d3.js <script src="http://d3js.org/d3.v3.min.js"></script>
B.在<body>...</body>內的<script>...</script>
* 建立 SVG圖形區:
d3.select('body')
.append('svg')
.attr({
'width':200,
'height':200
});
* 繪製圓形
d3.select('svg')
.append('circle')
.attr({
'cx':50,
'cy':50,
'r':30,
'fill':'yellow',
'stroke':'blue',
'stroke-width':'5px'
});
3.javascript + d3.js 程式化線段設計
(1)HTML 網頁程式參考
|
HTML程式碼 |
執行結果 |
|
<!DOCTYPE html>
<html>
<head>
<script src="http://d3js.org/d3.v3.min.js"></script>
</head>
<body>
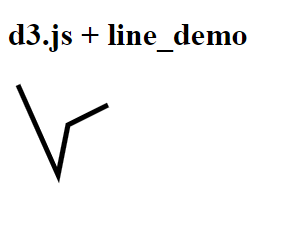
<h1>d3.js + linedemo </h1>
<script>
var data = [
{x:10,y:10},
{x:50,y:100},
{x:60,y:50},
{x:100,y:30}
];
var svg = d3.select('body')
.append('svg')
.attr({
'width': 800,
'height': 800
});
var line = d3.svg.line()
.x(function(d) {
return d.x;
})
.y(function(d) {
return d.y;
});
svg.append('path')
.attr({
'd': line(data),
'y': 0,
'stroke': '#000',
'stroke-width': '5px',
'fill': 'none'
});
</script>
</body>
</html> |
 |
(2)程式設計說明
A.引入 d3.js <script src="http://d3js.org/d3.v3.min.js"></script>
B.在<body>...</body>內的<script>...</script>
* 建立 data[]陣列資料來源:
var data = [
{x:10,y:10},
{x:50,y:100},
{x:60,y:50},
{x:100,y:30}
];
* 建立 line()函數:
var
line = d3.svg.line()
.x(function(d) {
return d.x;
})
.y(function(d) {
return d.y;
});
* 以SVG path 方式建立線段圖形:
svg.append('path')
.attr({
'd':
line(data),
'y': 0,
'stroke':
'#000',
'stroke-width': '5px',
'fill': 'none'
});
3.javascript + d3.js 程式化長條圖設計
(1)HTML 網頁程式參考
|
HTML程式碼 |
執行結果 |
|
<!DOCTYPE html>
<html>
<head>
<style>
.bar {
display: inline-block;
width: 20px;
height: 75px;
margin-right: 3px;
background-color: RoyalBlue;
}
</style>
<script src="http://d3js.org/d3.v3.min.js"></script>
</head>
<body>
<h1>d3.js + 長條圖_demo </h1>
<div class='demo'></div>
<script>
var dataset =
[30,26,27,31,13,10,20,20,24,25,25,21,17,21,6,7,13,23,27,31];
d3.select('.demo').selectAll('div') //選取 class內的div
.data(dataset) // 將資料加入至 div
.enter() // return data
.append('div') // 這邊加入的div已經有包含data
.attr('class','bar') //套用class
.style('height', function(d){ //將data的值取出作為高
return (d*3) + 'px'
})
</script>
</body>
</html> |
 |
(2)程式設計說明
A.引入 d3.js <script src="http://d3js.org/d3.v3.min.js"></script>
B.在<body>...</body>內的<script>...</script>
* 建立 dataset[]陣列資料來源:
var
dataset = [30,26,27,31,13,10,20,20,24,25,25,21,17,21,6,7,13,23,27,31];
* 建立 bar 的CSS格式:
.bar {
display:
inline-block;
width: 20px;
height: 75px;
margin-right:
3px;
background-color: RoyalBlue;
}
*
以d3.select().data().enter().append().attr().style() 建立長條圖
d3.select('.demo').selectAll('div') //選取 class內的div
.data(dataset) // 將資料加入至 div
.enter() // return data
.append('div') // 這邊加入的div已經有包含data
.attr('class','bar') //套用class
.style('height', function(d){
//將data的值取出作為高
return (d*3) + 'px'
})
4.SVG路徑圖形與文字結合應用
(1)HTML網頁程式參考
|
HTML程式碼 |
執行結果 |
<!doctype html>
<html>
<head>
<script src="https://d3js.org/d3.v3.min.js"></script>
<script src="https://ajax.googleapis.com/ajax/libs/jquery/3.4.1/jquery.min.js"></script>
</head>
<body>
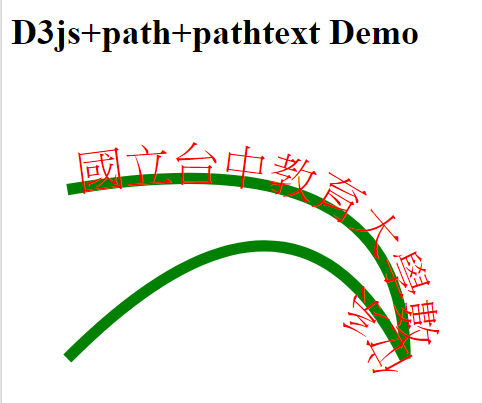
<h1>D3js+path+pathtext Demo</h1>
<script>
$(function(){
// 在 body 中插入一個 svg
var svg = d3.select('body').append('svg').attr({'width':500,'height': 500});
// 先在 svg 中插入一個 path
svg.append('path').attr({
id: 'mypath',
d: 'M50 100Q350 50 350 250Q250 50 50 250'
}).style({
fill: 'none',
stroke: 'green',
'stroke-width': 10
});
// 接著在 svg 中插入一個 text
// 並在 text 中插入一個 textPath
svg.append('text').attr({
x: 10,
y: 20
}).style({
fill: 'red',
'font-size': '42px'
}).append('textPath').attr({
'xlink:href': '#mypath'
}).text('國立台中教育大學數位系');
});
</script>
</body>
</html>
|
 |
(2)程式說明
A.引入jquery與d3.js
<script src="https://d3js.org/d3.v3.min.js"></script>
<script src="https://ajax.googleapis.com/ajax/libs/jquery/3.4.1/jquery.min.js"></script>
B.建立 SVG的大小,會影響後續圖文的出現效果
var svg = d3.select('body').append('svg').attr({'width':500,'height':
500});
5.javascript + d3.js 程式化資料導向的圓形圖設計
(1)HTML網頁程式參考
|
HTML程式碼 |
執行結果 |
|
<!doctype html>
<html>
<head>
<script src="https://d3js.org/d3.v3.min.js"></script>
<style>
</style>
</head>
<body>
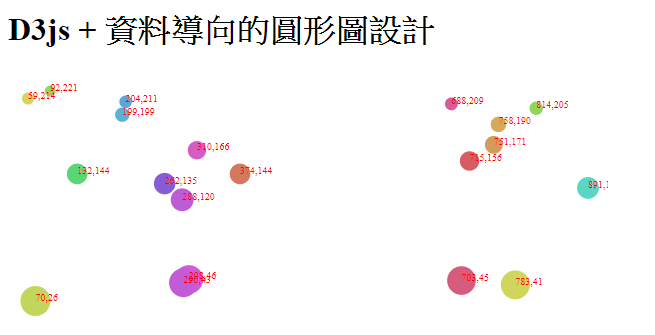
<h1>D3js + 資料導向的圓形圖設計</h1>
<div class='demo'>
</div>
<script>
//定義SVG的大小
var w = 600,h = 250,padding = 20;
//亂數產生與取得陣列資料
var dataset = [];
for (var i=0; i < 20; i++){
var Num1 = 5 + Math.floor(Math.random() * 900);
var Num2 = 5 + Math.floor(Math.random() * 220);
dataset.push([Num1, Num2]);
};
//取得資料的最大值、最小值
var Xmax = d3.max(dataset, function(d){return d[0]}),
Xmin = d3.min(dataset, function(d){return d[0]}),
Ymax = d3.max(dataset, function(d){return d[1]}),
Ymin = d3.min(dataset, function(d){return d[1]})
//輸出的範圍是左邊的padd距離,到右邊的padding
var xScale = d3.scale.linear() //產生一個屬於X軸的線性尺度
.domain([Xmin, Xmax]) //傳入的值是原始資料的最小及最大值
.range([padding , w - padding])
//類似X軸的尺度
var yScale = d3.scale.linear()
.domain([Ymin, Ymax])
.range([ h - padding ,padding])
//產生SVG圖形區
var svg = d3.select('.demo').append('svg').attr({'width': w,'height':
h})
//dataset與物件進行連結
//選取'circle'並把資料加入
svg.selectAll('circle').data(dataset).enter()
.append('circle') // 增加圓到SVG內
.attr({ //加入屬性到圓
'cx': function(d){return xScale(d[0])}, //利用尺度算出X的位置
'cy': function(d){return yScale(d[1])}, //同理算出Y
'r': function(d){return Math.sqrt(h - d[1])}, //圓的大小是高 - Y值的平方
'fill': function(d){return d3.hsl(d[0] % 360, .6, .6 );}
//介紹一個顏色的function hsl,可以將顏色算出後轉成色碼
//格式 (360色相, 彩度, 明度)
});
//補上資料數值
svg.selectAll('text').data(dataset).enter()
.append('text')
.text(function(d){ return d[0]+ ',' + d[1]}) //將值寫到SVG上
.attr({
'x': function(d){return xScale(d[0])}, //和上面相同,算出X、Y的位置
'y': function(d){return yScale(d[1])},
'fill': 'red', //文字填滿為紅色
'font-size': '10px' //Fill、font-size也可以用CSS寫喔∼
});</script>
</body>
</html> |
 |
(2)程式設計說明
A.d3.max(),d3.min():取得資料的最大值、最小值。
B.d3.hsl():依參數取得顏色值。